When it comes to summarizing the data, standard deviation (σ) is the value which tells us about the spread of the data. More specifically, it gives information about the dispersion of each observation from the mean of the data. Now, if you are interested in understanding Mean and knowing how to calculate it, then we have shown you in CALCULATING GEOMETRIC MEAN USING R AND PYTHON And APPLICATION OF HARMONIC MEAN USING R AND PYTHON.
Thus, in essence standard deviation gives us valuable information about the robustness of the mean. The deviation is in both positive and negative direction of the mean.
Therefore, it is desirable for the standard deviation to be a low value in comparison to the mean. This would indicate a smaller spread.
Mathematically speaking, standard deviation is known as the second moment about Mean. Variance is standard deviation squared. The variance does not have any mathematical significance on its own. Think of the variance as a mere mathematical maneuver.
The formula for the Variance is:
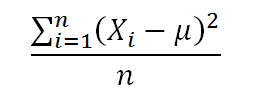

Application:
An investor wants to calculate the Standard Deviation experience by his investment portfolio in last 12 months (Year 2017-2018). The returns are:-
Month (Year 2017-18) | Returns (%) |
|---|---|
April | 12% |
May | 10% |
June | -8% |
July | 4% |
August | 12.25% |
September | 18% |
October | 13% |
November | -9% |
December | -4% |
January | 3% |
February | 9% |
March | 11.05% |

Calculate Standard Deviation in R:
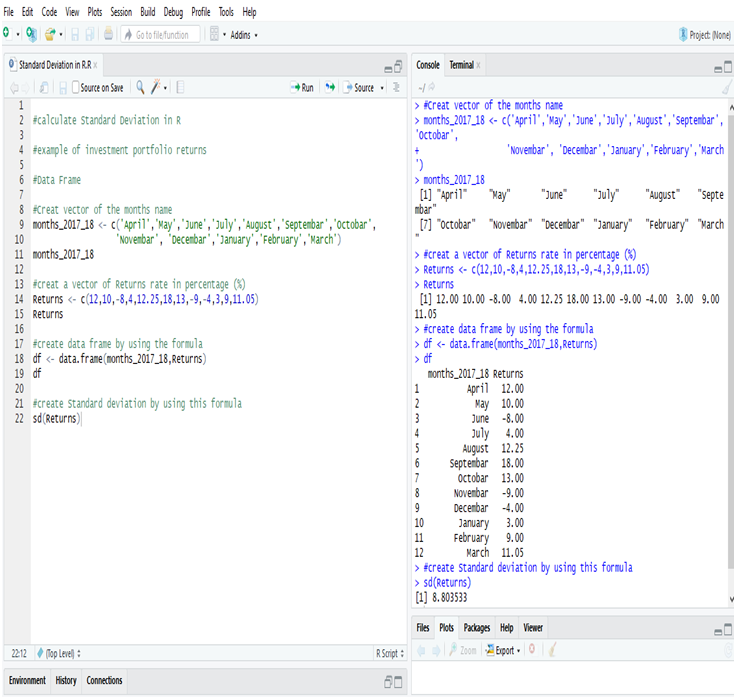
Examining the Standard Deviation of the investment portfolio returns of a year in R, we get the deviation = 8.803533 or, 8.81% (Approx).
Calculate Standard Deviation in Python:
First, create a Data Frame in Python.
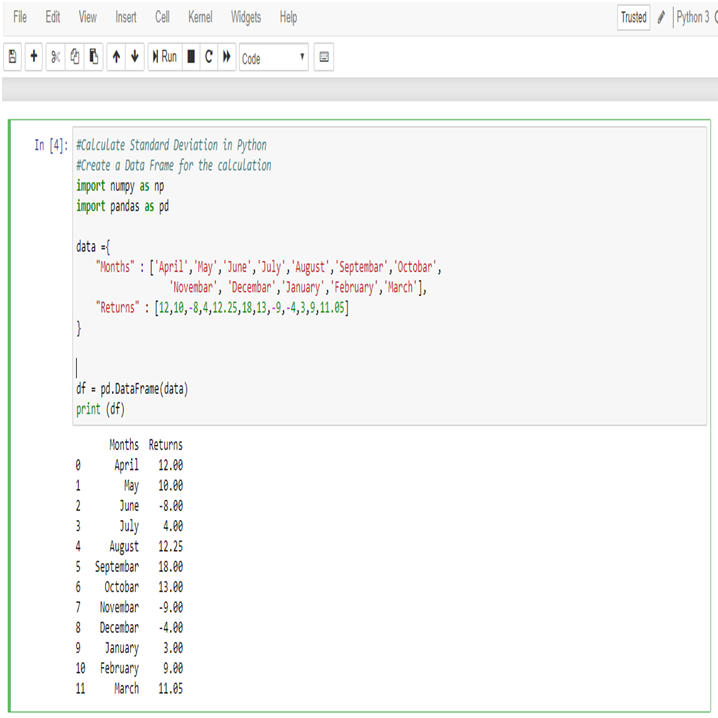
Now, calculate Standard Deviation of the returns,
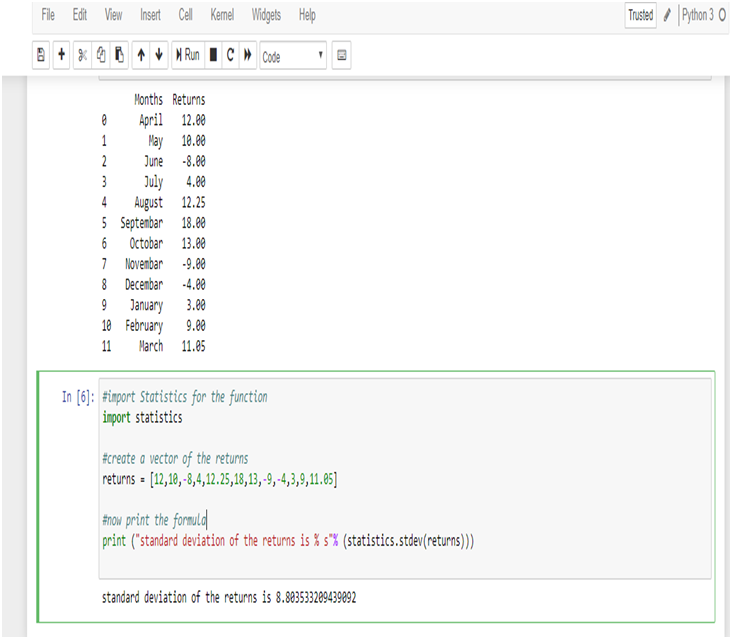
Examining the Standard Deviation of the investment portfolio returns of a year in Python, we get the deviation = 8.803533209439092 or, 8.81% (Approx)
Standard Deviation is a key part of calculating margins of errors.
Standard deviation shows the variation from the mean. A low standard deviation indicates that the observations (series of number) are very close to the mean. A high standard deviation indicates that the observations (series of numbers) are spread out over a large range.
In this data the mean of the returns is 5.95%, and standard deviation is 8.81% which is close to the mean. So, the deviation of the data is low.
Thus, the investor now knows that the returns of his portfolio fluctuate by approximately 8.81% month-over-month. The information can be used to modify the portfolio to better the investor’s attitude towards risk. If the investor is risk-loving and is comfortable with investing in higher-risk, higher-return securities and can tolerate a higher standard deviation, he/she may consider adding in some small-cap stocks or high-yield bonds. Conversely, an investor who is more risk-averse may not be comfortable with this standard deviation and would want to add in safer investments such as large-cap stocks or mutual funds.
Endnotes
This article will surely help you to figure out the standard deviation with R and Python. However, if you want to have a general idea about Central tendency, about Mean, Median and Mode, then go through our blog on STATISTICAL APPLICATION IN R & PYTHON: CHAPTER 1 – MEASURE OF CENTRAL TENDENCY.
For all other information about us and our courses, Dexlab Analytics is there with you. You can also follow us on Facebook and LinkedIn and go through our blogs to stay updated always.
Interested in a career in Data Analyst?
To learn more about Data Analyst with Advanced excel course – Enrol Now.
To learn more about Data Analyst with R Course – Enrol Now.
To learn more about Big Data Course – Enrol Now.To learn more about Machine Learning Using Python and Spark – Enrol Now.
To learn more about Data Analyst with SAS Course – Enrol Now.
To learn more about Data Analyst with Apache Spark Course – Enrol Now.
To learn more about Data Analyst with Market Risk Analytics and Modelling Course – Enrol Now.
Python certification, python certification course, Python courses, python data science course, Python Training Institute, R language training, R programming certification, R Programming Training, R Programming Training course, R programming training institute, R programming using Python, Software tools : SAS, R, Python etc
Comments are closed here.