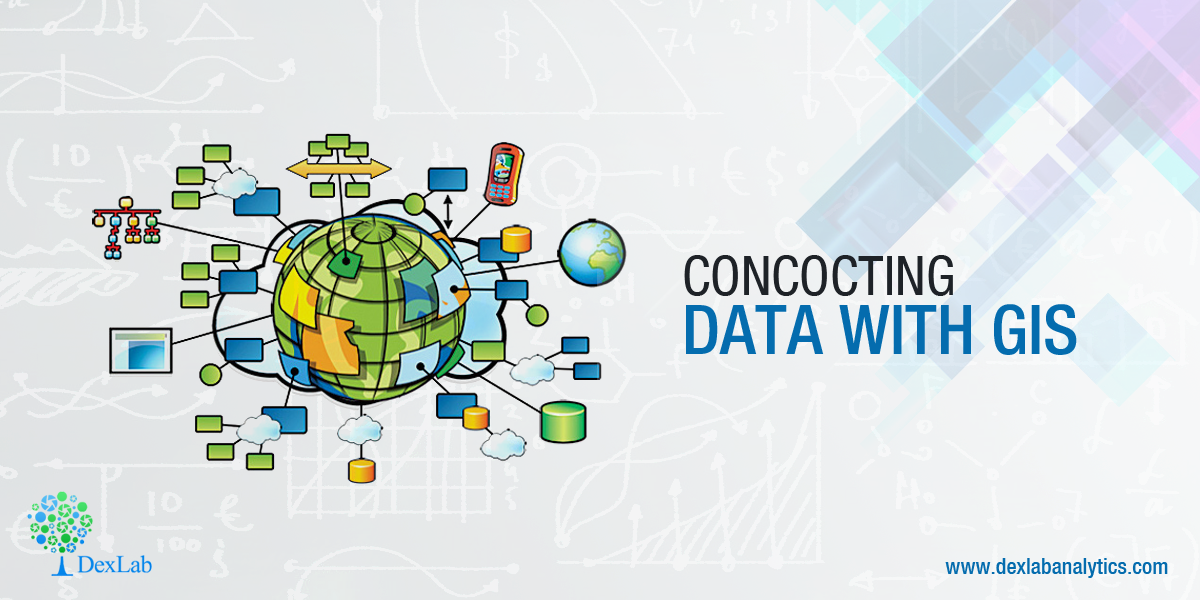
In supreme and sophisticated geospatial realm, data have been predominant. Or, should I say it is the matured fosterling of Geographic Information Systems (GIS). Choose, whatever suits you; subject to whom you work for or what you need to work on. The meat and potatoes? To excel on location analytics, concentrate only on the best most current data.

In today’s world, data is valuable. It is vital and veritable. It is indispensable in Geographic Information Systems (GIS).
To second that, today’s tech-efficient society is anchored on location-based data, than ever, especially with the rise in Twitter, Google, Facebook and other social media apps, which collects and stores data from their highly-valued users to sell them off to money-grubbing advertisers. Though secretly. On the other hand, cell phones go a step ahead in broadcasting your current location data 24/7. Otherwise, how would your friends know that you are safe when a severe earthquake rattled your neighbouring city! (Thanks to location settings)
Feisty Predicaments
However, the real challenge lies in data identification and consumption. Countless number of users gets baffled when it comes to finding data, and if found, how to consume it to set off their business determinations. To solve this, many imminent think tanks of tech industry came out with direct and decisive solutions. Some of them were loaded with an abundance of data, i.e. digestible and disintegrated. By disintegration, they meant that the data was categorized into: points of interest, roads, boundaries and demographics, for easy comprehensibility. Furthermore, industry data bundles concerning telecommunications, retail and insurance fields were added to make the coverage global and profitable. To top it off, quality content and sprawling file formats boosted the results and mechanisms, both.
Conflux of GIS and BI
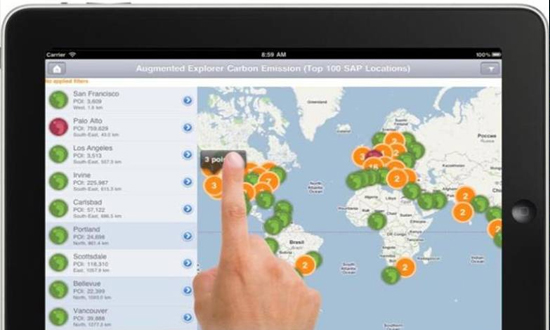
Location technology – Does this ring a bell? Yes? Then you would be familiar with GIS but others, particularly new Business Intelligence users and consumers must have just started taking baby steps on basic mapping. For BI, maps are the backdrop against which business analysts project their business data, stats and analytical information. Analysing the data to understand the insights of consumers is crucial, directly affecting the business decisions and revenues thereby. For example, heat maps, used to see the concentration of installations, customers and IoT devices provides an unparalleled accurateness of spatial relationships, which is impossible to obtain from the spreadsheets.
Seeking data analytics certification courses to boost your business growth? Go through our comprehensive Online Courses in data science at DexLab Analytics.
One of the integral location analytics issues is to help in identifying the high-risk zones at the time of natural disasters, like tornadoes, earthquakes, floods, hurricanes or mudslides. For example, in the US, the East Coast is vulnerable to a lot of hurricanes and floods, whereas earthquakes and mudslides snap the West Coast time to time. Assessment of these location problems is intrinsically important for mortgage underwriters, insurance agents and public safety departments. And best data along with effective geo-coding is the solution to all the inconveniences.
Discover easy Data Science Courses Online by logging in to DexLab Analytics. To know more on Business Analytics Online Certification, contact us.
Interested in a career in Data Analyst?
To learn more about Machine Learning Using Python and Spark – click here.
To learn more about Data Analyst with Advanced excel course – click here.
To learn more about Data Analyst with SAS Course – click here.
To learn more about Data Analyst with R Course – click here.
To learn more about Big Data Course – click here.
Comments are closed here.