Programming skills are indispensable for data science professionals. The main job of machine learning engineers and data scientists is drawing insights from data, and their expertise in programming languages enable them to do this crucial task properly. Research has shown that professionals of the data science field typically work with three languages simultaneously. So, which ones are the most popular? Are some languages more likely to be used together?
Recent studies explain that certain programming languages are used jointly besides other programming languages that are used independently. With the survey data collected from Kaggle’s 2018 Machine Learning and Data Science study, usage patterns of over 18,000 data science experts working with 16 programming languages were analyzed. The research revealed that these languages can actually be categorized into smaller sets, resulting in 5 main groupings. The nature of the groupings is indicative of specific roles or applications that individual groups support, like analytics, front-end work and general-purpose tasks.

Principal Component Analysis for Dimension Reduction
In this article, we will explain how Bob E. Hayes, PhD holder, scientist, blogger and data science writer has used principal component analysis, a type of data reduction method, to categorize 16 different programming languages. Herein, the relationship among various languages is inspected before putting them in particular groups. Basically, principal component analysis looks into statistical associations like covariance within a large collection of variables, and then justifies these correlations with the help of a few variables, called components.
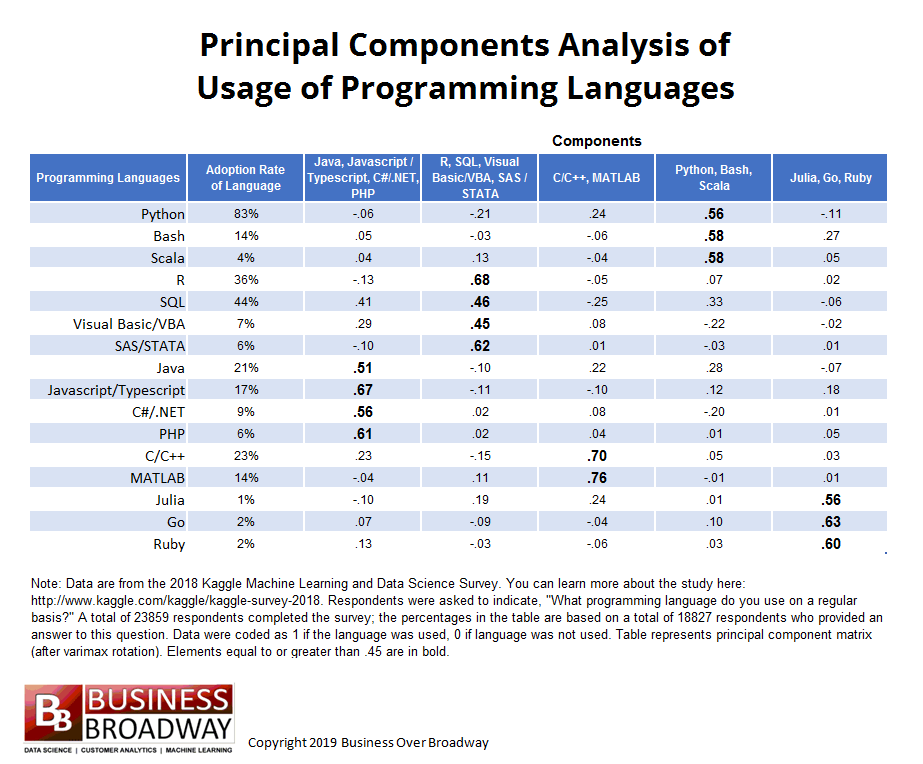
Principal component matrix presents the results of this analysis. The matrix is an nXm table, where:
n= total no. of original variables, which in this case are the number of programming languages
m= number of main components
The strength of relationship between each language and underlying components is represented by the elements of the matrix. Overall, the principal component analysis of programming language usage gives us two important insights:
- How many underlying components (groupings of programming languages) describe the preliminary set of languages
- The languages that go best with each programming language grouping
Result of Principal Component Analysis:
The nature of this analysis is exploratory, meaning no pre-defined structure was imposed on the data. The result was primarily driven by the type of relationship shared by the 16 languages. The aim was to explain the relationships with as less components as possible. In addition, few rules of thumb were used to establish the number of components. One was to find the number of eigen values with value greater than 1 – that number determines the number of components. Another method is to identify the breaking point in the scree plot, which is a plot of the 16 eigen values.
businessoverbroadway.com
5-factor solution was chosen to describe the relationships. This is owing to two reasons – firstly, 5 eigen values were greater than one and secondly, the scree plot showed a breaking point around 6th eigen value.
Following are two key interpretations from the principal component matrix:
- Values greater than equal to .45 have been made bold
- The headings of different components are named on the basis of tools that loaded highly on that component. For example, component 4 has been labeled as Python, Bash, Scala because these languages loaded highest on this component, implying respondents are likely to use Bash and Scala if they work with Python. Other 4 components were labeled in a similar manner.
Groupings of Programming Languages
The given data set is appropriately described by 5 tool grouping. Below are given 5 groupings, including the particular languages that fall within the group, meaning they are likely to be used together.
- Java, Javascript/Typescript, C#/.NET, PHP
- R, SQL, Visual Basic/VBA, SAS/STATA
- C/C++, MATLAB
- Python, Bash, Scala
- Julia, Go, Ruby
One programming language didn’t properly load into any of the components: SQL. However, SQL is used moderately with three programming languages, namely Java (component 1), R (component 2) and Python (component 4).
It is further understood that the groupings are determined by the functionality of different languages in the group. General-purpose programming languages, Python, Scala and Bash, got grouped under a single component, whereas languages used for analytical studies, like R and the other languages under comp. 2, got grouped together. Web applications and front-end work are supported by Java and other tools under component 1.
Conclusion:
Data science enthusiasts can succeed better in their projects and boost their chances of landing specific jobs by choosing correct languages that are suited for the job role they want. Being skilled in a single programming language doesn’t cut it in today’s competitive industry. Seasoned data professionals use a set of languages for their projects. Hence, the result of the principal component analysis implies that it’s wise for data pros to skill up in a few related programming languages rather than a single language, and focus on a specific part of data science.
For more help with your data science learning, get in touch with DexLab Analytics, a leading data analyst training institute in Delhi. Also check our Machine learning courses in Delhi to be trained in the essential and latest skills in the field.
Interested in a career in Data Analyst?
To learn more about Data Analyst with Advanced excel course – Enrol Now.
To learn more about Data Analyst with R Course – Enrol Now.
To learn more about Big Data Course – Enrol Now.To learn more about Machine Learning Using Python and Spark – Enrol Now.
To learn more about Data Analyst with SAS Course – Enrol Now.
To learn more about Data Analyst with Apache Spark Course – Enrol Now.
To learn more about Data Analyst with Market Risk Analytics and Modelling Course – Enrol Now.
Comments are closed here.