
In the present data frenzy setting, data visualization is the new Talk of the Town. Various companies are developing and launching their own data visualization tools in the market. For quite some time now, Tableau has been the pioneering data visualization platform and till date the best to consider. Tableau’s data visualization tool is unbeatable to any other emerging product in the digital community.
Apparently, Tableau has a remarkable competitor, recently. It is the Power BI, a decisive and dynamic BI tool, brought into by Microsoft. It is catching the trend with Tableau fast and appears to be on its way to become the number one BI tool in the digital market.
Talking about features, there is little room to establish a set of comparisons between Power BI and Tableau, as Power BI is better equipped with scintillating features. Putting it aside, Tableau comes with its own respective advantages, like high-end visualizations and superb scalability.
Is data visualization your business’ prime focus? If yes, Tableau will be the perfect solution for your venture. However, if you are on a look out for a platform, excelling on versatile analytic capabilities, including predictive modelling, optimizing and reporting, Power BI suite will be the real deal-breaker.
In terms of tools and abilities, Power BI and Tableau boasts of two major differences:
Visualizations
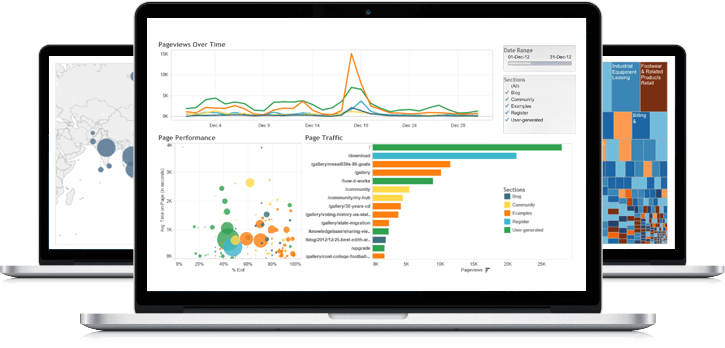
Data visualization is crucial. Tableau strongly emphasizes on visuals, while Power BI mostly stresses on dynamic data manipulation features along with providing access to basic visualizations. Under Power BI, users select the visualization first and then drag the data into it. It is easy to upload data sets. On the other hand, Tableau offers sophisticated visualizations for larger data sets as compared to Power BI. Here, users can select the data and switch between visualizations on the go. Hoping between visualizations is easier in Tableau.

In-depth analysis
Analysis of data by each solution is distinctive in its own ways. Where Tableau lays stress on the front end, Power BI works more on the back-end depth. Better analyses of data is possible with Power BI than it was with Excel. The meat and potatoes of Power BI is to provide faster analyses of standard data sets. In case of Tableau, the features highlighted here ensure users ways to answer questions while they delve deeper into investigating data visualizations. The strategy displays basic trends as forecasts, implement ‘what if’ questions to calibrate data hypothetically and visualize ingredients of data dynamically for better comparison and contrast.
When it comes to investigating familiar sets of data and Excel is no more efficacious, Power BI is highly recommended. Contrarily, for interactive superior visualizations, Tableau remains unparalleled. However, it fails to casts its charm in manipulating data, where its tailing counterpart Power BI proves its superiority.

Drawing an inference – Tableau is my personal favourite and is still the most productive BI Tool available in the market. However, from a business perspective, Power BI is continuously on its endeavour to elevate its quality and is at present one of the most appealing products in the data viz world.
For a bright career in data analytics, enrol for intensive tableau training courses. DexLab Analytics is a top-notch data science online learning platform. Run your eyes through their tableau BI training courses today.
Interested in a career in Data Analyst?
To learn more about Data Analyst with Advanced excel course – Enrol Now.
To learn more about Data Analyst with R Course – Enrol Now.
To learn more about Big Data Course – Enrol Now.To learn more about Machine Learning Using Python and Spark – Enrol Now.
To learn more about Data Analyst with SAS Course – Enrol Now.
To learn more about Data Analyst with Apache Spark Course – Enrol Now.
To learn more about Data Analyst with Market Risk Analytics and Modelling Course – Enrol Now.
online certification, online courses, Tableau BI Certification, tableau certification, tableau course details, tableau training institute
Comments are closed here.