
Today we are going to learn about the new releases from Scikit-learn version 0.22, a machine learning library in Python. We, through this video tutorial, aim to learn about the much talked about new release called Plotting API. Prior to this version, Scikit-learn did not have a function to plot the ROC curve.
A new plotting API is available for creating visualizations. The new API allows for quickly adjusting the visuals of a plot without involving any recomputation. It is also possible to add different plots to the same figure. In this tutorial we are going to study the plotting of the ROC curve.
The code sheet is provided in a Github repository here.
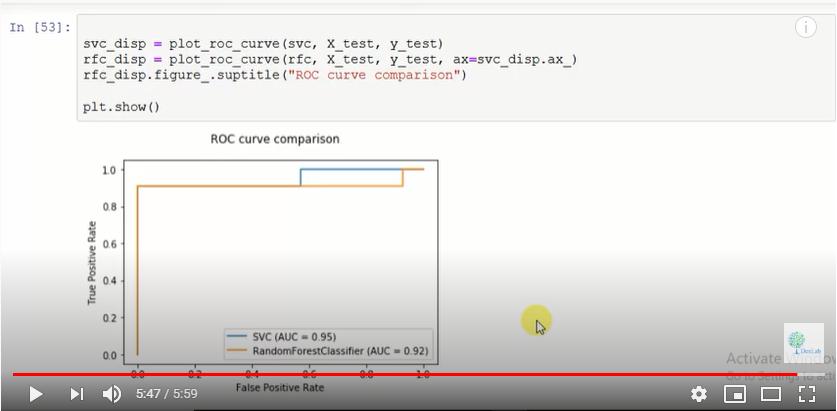
We will attempt to plot the ROC curve on two different algorithms and compare which one is a better function. First we choose to make a classification data. Then we go on to plot the ROC curve using SVC classifier and then further plot the curve using a random forest classifier.
Fig. 1
For more on this do watch the video attached herewith. This tutorial was brought to you by DexLab Analytics. DexLab Analytics is a premiere Machine Learning institute in Gurgaon.
.
Comments are closed here.