Tableau and Google Trends? Wow, what a smashing combination to tick all the right boxes!!

Also, you would be more than happy to know how some sections in your data have gotten along in search over time as compared to the others. Undeniably.
One and a half year back, Google Trends was used in a very basic way, where one had to download the CSV from Google Trends, all manually. Google didn’t have an API for Google Trends and is yet to get one.
So, are you out of luck? Still scampering to devise a way to automatically pull search-interest data into Tableau, while the latter gears up making an API for Google Trends?
Here’s a quick solution to add Google Trends Data to a Tableau dashboard and the trick lies in the details of the Google Trends URL parameter scheme and Tableau’s web page dashboard object.
We have taken a fast-food survey data to explain the process. Dive in.
Best fries, best burgers
Discover the best fast-food chain that offers best deals, with YouGov survey! The survey respondents bring out the best answer possible.

Steps to follow:
Create a new sheet
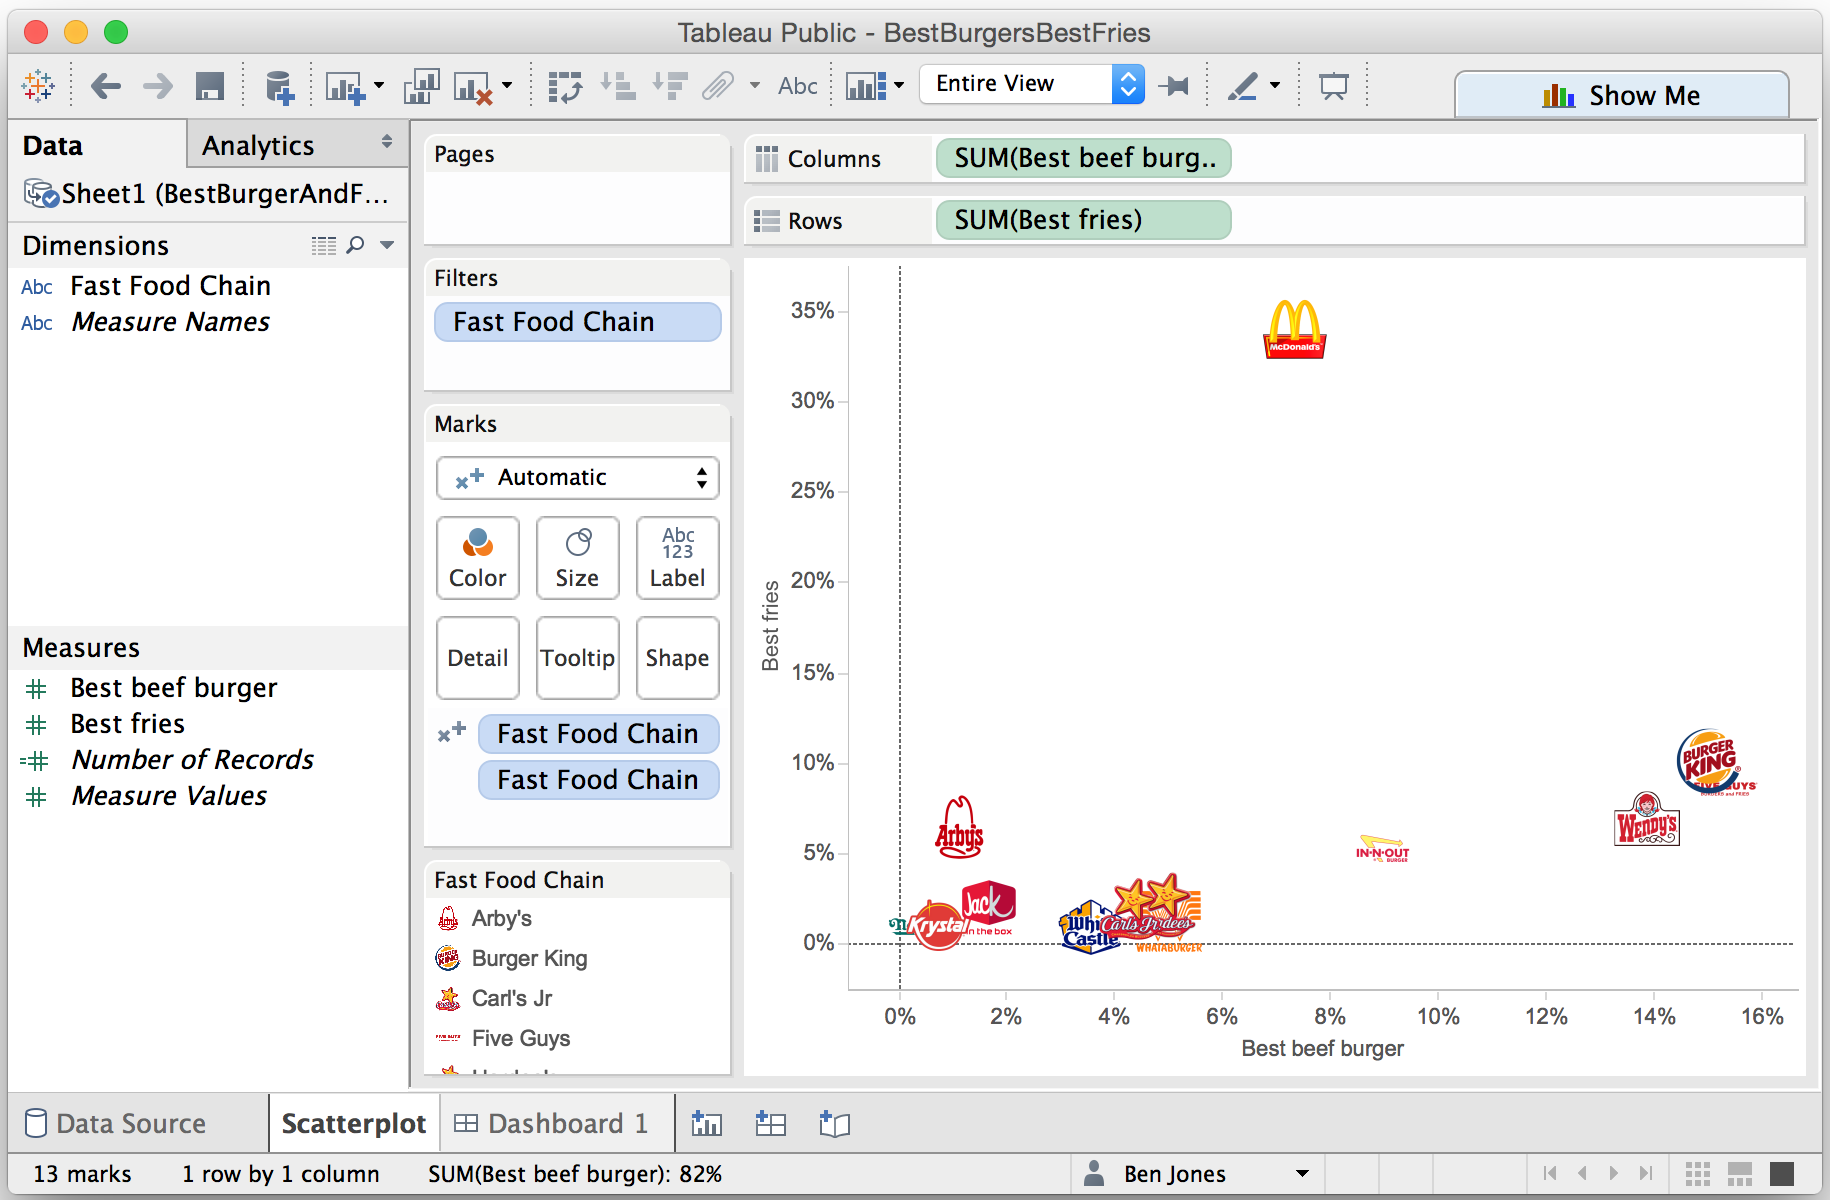
In an easy and straightforward manner we first created a basic Excel table from YouGov survey results, in which respondents gave clear-cut answers about which restaurant serves the best burgers and fries.
Then we dragged “best beef burger” to the Columns shelf and “best fries” to the Rows shelf – you can also include fast food logos like us by dragging “fast food chain” to Shape but don’t forget to have a folder with the logo PNG files in Documents/My Tableau Repository/Shapes folder.
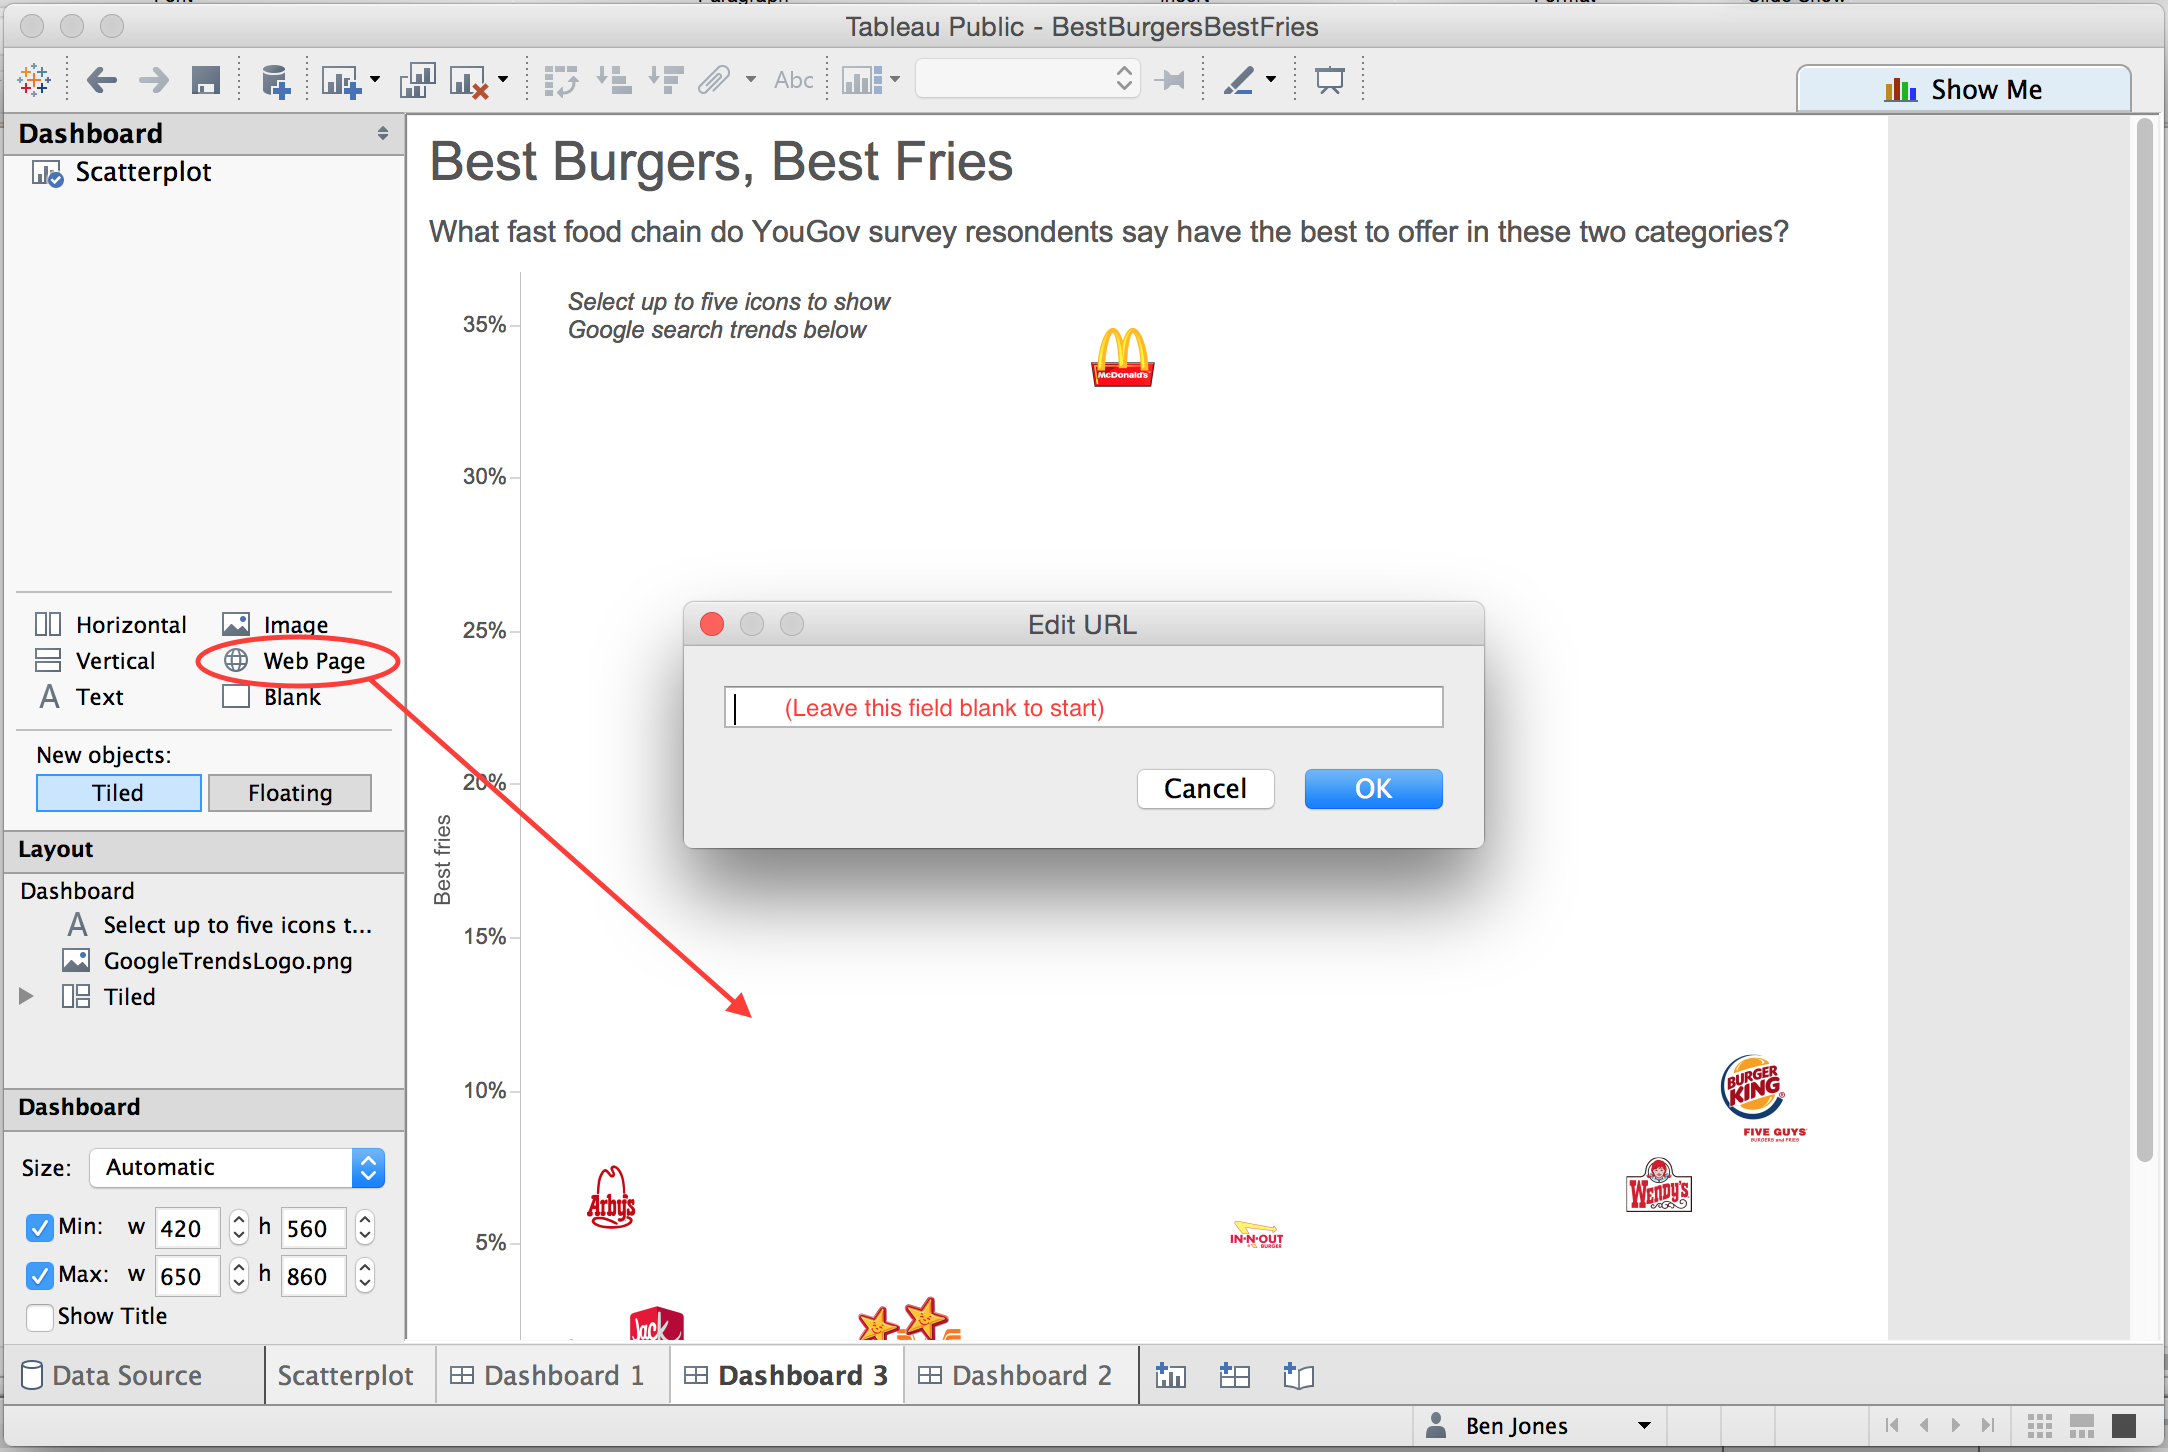
Develop a new dashboard and introduce a blank webpage object
As soon as we were done with scatter plot, we started working on a new dashboard – where we dragged the scatter plot sheet in. While dragging over a new webpage object, make sure to leave the “Edit URL” field blank in the subsequent dialog box.
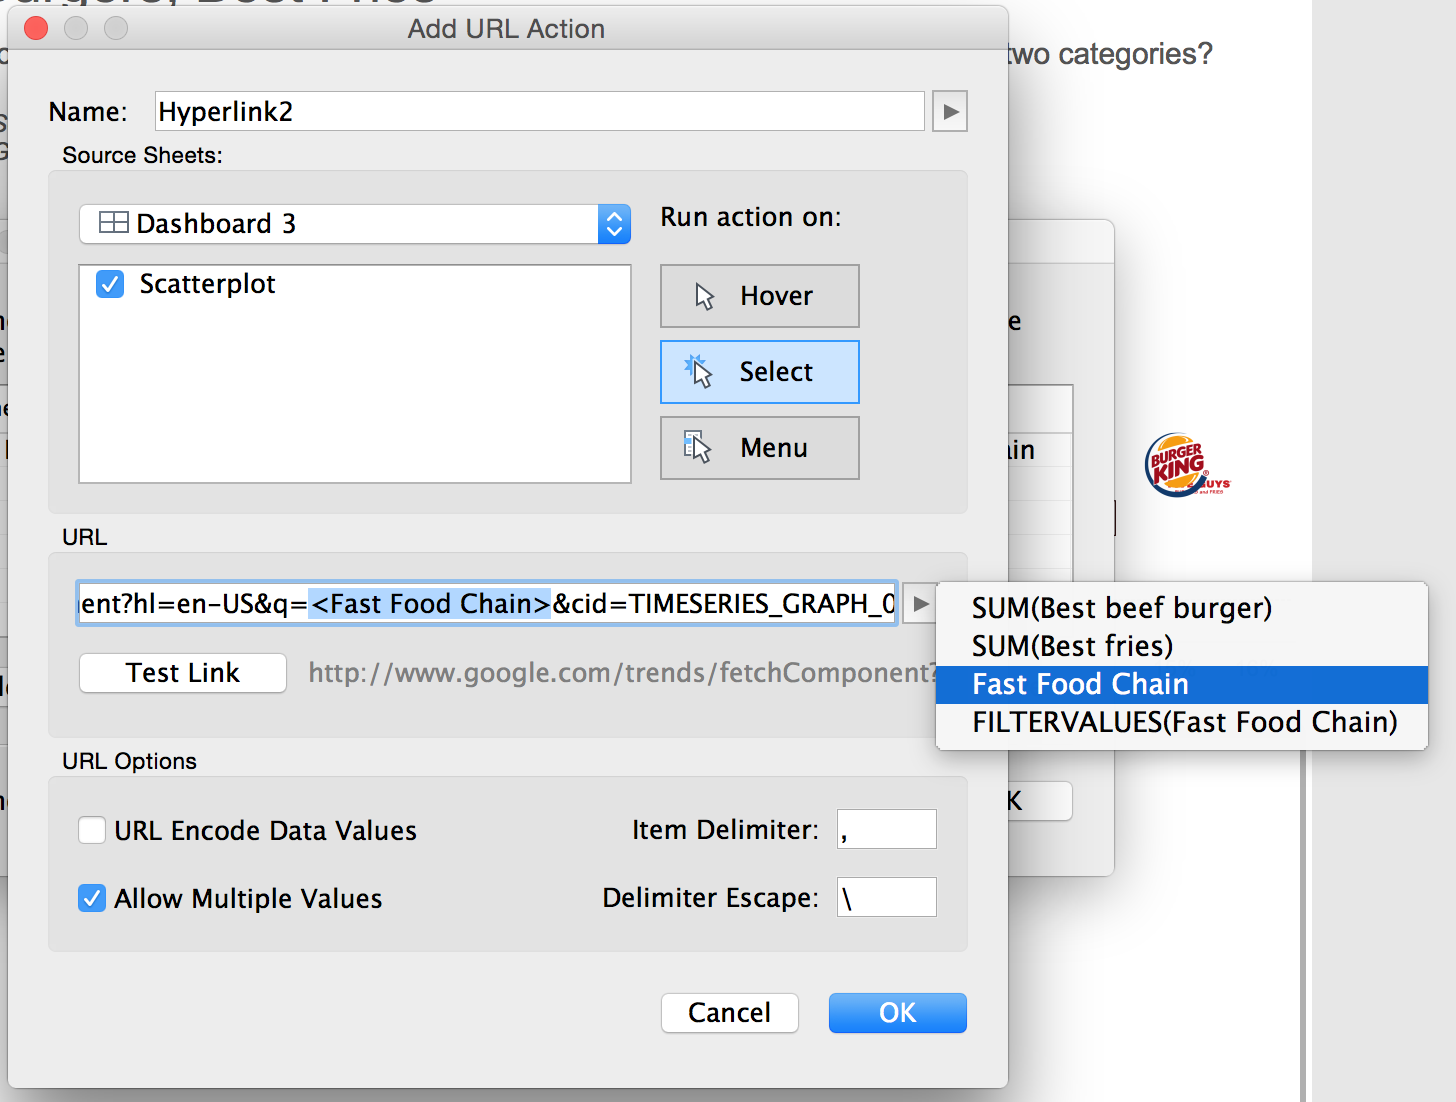
Formulate a brand new URL dashboard action
Now with better controls, after the web page object was displayed on the dashboard, we could manage the website that gets exhibited inside the box by building a URL dashboard action.
For that, click Dashboard > Action > Add Action > URL.
Develop Google Trends URL in the URL Action Dialog
https://www.google.com/trends/fetchComponent?hl=en-US&q=DIMENSION_FIELD_NAME&cid=TIMESERIES_GRAPH_0&export=5&w=500&h=300
Nothing more was needed! We have just copy and pasted this URL in the “Edit URL” field.
However, pay heed to replace DIMENSION_FIELD_NAME by the data field containing the values you look forward to compare in search interest. In our example, we have used “fast food chain” capped by angle brackets. Also note, that we have changed the URL too, it now runs on Select instead of Menu:
So, here we are! This is all we have to say.
Google Trends is a BOMB but there are certain limitations, which you need be aware of.
Google Trends does have a search quota, hence it is possible for you to hit the limit, while developing dashboard or trying your hands on other things. Suggestion: wait for a couple of hours and you will be good to go!

Hope, this blog can be of some help to you. For more information on Tableau BI training courses, drop by DexLab Analytics. Their data visualization courses in Delhi NCR are stellar, enroll now.
Interested in a career in Data Analyst?
To learn more about Machine Learning Using Python and Spark – click here.
To learn more about Data Analyst with Advanced excel course – click here.
To learn more about Data Analyst with SAS Course – click here.
To learn more about Data Analyst with R Course – click here.
To learn more about Big Data Course – click here.
Comments are closed here.