Microsoft Excel is a smorgasbord of information – it is a staple technology tool in any business environment. Whether you are crunching business data, organizing client sales inventory or planning an office event, Excel is arguably the most powerful tool entrenched across multiple business domains worldwide.
Aspiring professionals contemplating to make an entry into the workplace are required to excel on Excel tricks – Excel Dashboards Training Pune from DexLab Analytics is a promising gateway to your dreams!

Finance and Accounting
If you have ever visited the finance or accounts department of any topping conglomerate’s corporate office, you will find computer screens popped open with languid Excel spreadsheets drafting financial results, forecasts, budgets and future plans to pull up bigger corporate decisions.
The world of finance largely relies on Excel spreadsheets – long, complex calculations are made easier with advanced formulas in Excel, which would have otherwise taken weeks to get completed.
If you are keen to learn more formulas, join DexLab Analytics – they offer advanced excel course in Pune.
Now do a lot more with advanced IF function in seamless sync with VLOOKUP, INDEX-MATCH-MATCH, and pivot tables!
Marketing and Management
While product management professionals look up to the financial management team to handle their financial analysis projects, by using spreadsheets to enlist customer data and sales targets you can help control sales force and improvise future marketing plans hinged on past results.
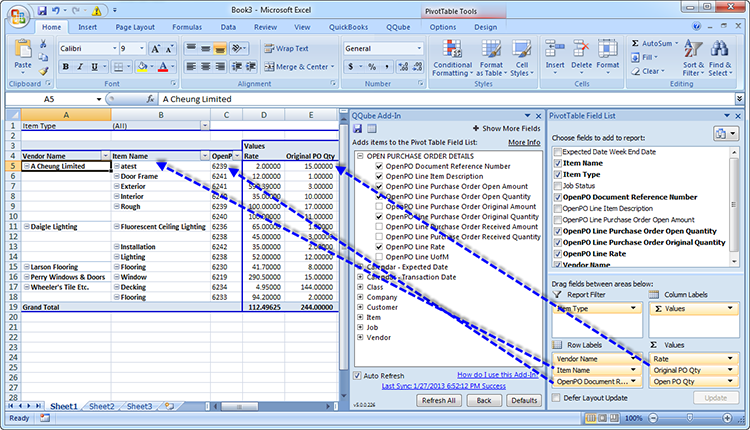
Use Pivot tables – they are an excellent tool to quickly summarize long customer and sales data – they categorize the data with a simple drag-and-drop option. All sectors of business benefits from powerful Excel knowledge, and marketing and management field is no different.
Human Resources
Though database systems, such as Oracle, Quickbooks and SAP are used to administer payroll and employee information, Excel represents how efficiently you can discover the latest trends, summarize expenses and calculate hours by pay period, month or year. It also helps in comprehending how a company’s strength is spread out across various functions and pay levels for better assessment of employee force.

HR professionals make best use of Excel – they fill these spreadsheets with employee data and nab the area of origin of costs to devise out a functional plan to control them in the future.
Things to do with Excel:
- Planning to take out your team to an exciting football match? Use the power of Excel to track the RSVP list and expenses.
- Based on past customer forecasts, Excel generates new revenue growth models for company products.
- When creating an editorial calendar for your website, jot down the dates and topics on a Spreadsheet.
- While budgeting for a petty product, you can write down expense categories in the spreadsheet, modify it monthly and develop a chart to exhibit how close the product should be budgeted across several categories.
- Excel helps you determine customer discounts based on monthly assessment of purchase volume by product.
No wonder, this is a very comprehensive enumeration to give you an idea of how Excel makes our lives easier in workplace – a majority of professionals needs to work on Excel for 4-5 hours a day, their job life is incomplete without this robust computing tool.

A working knowledge of Excel is crucial – potent Excel skills can open windows of opportunity for promotion and better leadership opportunities! Go play with Excel now!
Interested in a career in Data Analyst?
To learn more about Machine Learning Using Python and Spark – click here.
To learn more about Data Analyst with Advanced excel course – click here.
To learn more about Data Analyst with SAS Course – click here.
To learn more about Data Analyst with R Course – click here.
To learn more about Big Data Course – click here.
Comments are closed here.