The DexLab Analytics workshop is on Data Visualization with Tableau: Tableau is a Data Visualization tool that is widely used for Business Intelligence but is not limited to it. It helps create interactive graphs and charts in the form of dashboards and worksheets to gain business insights and all of this is made possible with gestures as simple as drag and drop. Tableau is a trending and market-leading BI tool used to visualize and analyse your data in an easily and digestible format. It allows you to work on live data-sets and spend more time on data analysis rather than data wrangling.
Tableau easily connects to nearly any data source, be it corporate Data Warehouse, Microsoft Excel or web-based data. Use Tableau and get connected to different data sources from files and servers. You can work on various file formats like CSV, JSON, TXT or even get your data imported from servers like Tableau Server, MySQL, Amazon Redshift & many more.
What will be covered: 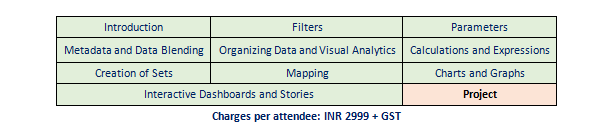
When & Where:
26th January 2020 (Sunday), 12:00 PM to 7:00 PM at DexLab Analytics, K 3/5, DLF Phase 2, Gurgaon, Haryana – 122002. (Nearest metro station: MG Road / Sikanderpur).
Lecture delivered by:
Gagan, an IT Consultant (Data Analytics and Automation) with a global full service IT consulting and outsourcing solutions provider has worked with companies like EXL over the past 7 years. He has worked for clients across the globe and is an expert in Data Analytics, Visualization, Modelling and Automation. He has trained over 5000 industry professionals on Data Analytics and Automation.
Learning Outcomes:
- Conduct and represent statistical analyses embedded in modern visualization package, generating insights into business KPI’s.
- Understand the business requirement to formulate analytical strategy, experience in handling big datasets.
- Creating advanced visualizations, formatting, calculations, tricks, and tips to use Tableau.
- Master data sources, concepts of tableau desktop and formatting data.
- Add a skill set in your ability to tell a story, simplify complex concepts, and visually Layout data.
Terms and Conditions:
- 100% Payment in advance to be made via PayTM / Google Pay.
- Laptops to be carried by every participant installed with Tableau Desktop trial version.
- Above mentioned prices are exclusive of Taxes.
- Ability to analyze and visualize data is required.
- Soft Copy of the study material will be shared with the participants.
We host exclusive Classroom Enterprise Training for corporate.
We would appreciate it if you forwarded this mail internally to your friends & colleagues who might be interested in attending this workshop. We would look forward to hearing from you.
For queries and enrollment call at +91 124 450 2444 / + 91 931 572 5902 or write to hello@dexlabanalytics.com.
Interested in a career in Data Analyst?
To learn more about Data Analyst with Advanced excel course – Enrol Now.
To learn more about Data Analyst with R Course – Enrol Now.
To learn more about Big Data Course – Enrol NowTo learn more about Machine Learning Using Python and Spark – Enrol Now.
To learn more about Data Analyst with SAS Course – Enrol Now.
To learn more about Data Analyst with Apache Spark Course – Enrol Now.
To learn more about Data Analyst with Market Risk Analytics and Modelling Course – Enrol Now.