
Everyone adores MS Excel. The powerful Excel software not only excels in doing basic computations but is also used for various formidable purposes, like financial modeling and business strategies. For novices, employing the skills of MS Excel can open new vistas in the world of data analytics. It is even being said – prior to R or Python, better grab the knowledge about Excel. Excel, with its wide array of functions, visualizations and skills empowers the users to quickly generate insights about data from the data, which would take a great toll otherwise.
Top 5 commonly used functions are highlighted below:
- Vlookup(): It works great in search of a value in a table and returns the corresponding value. For better understanding, take a look at the Policy Table.
For mapping the city name from the customer tables, based on a regular “customer id”, use function vlookup()
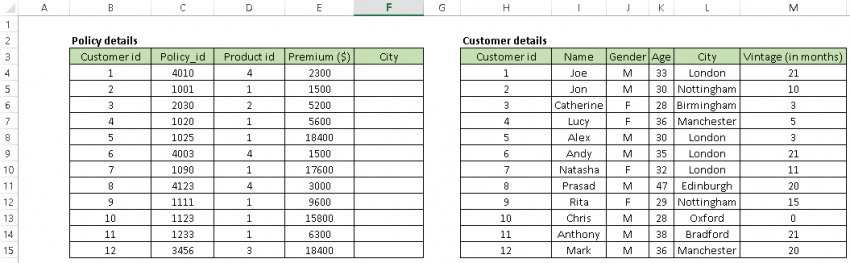
Syntax: =VLOOKUP(Key to lookup, Source_table, column of source table, are you ok with relative match?)
For this problem, we can type formula in cell “F4” as =VLOOKUP(B4, $H$4:$L$15, 5, 0) and this will return the city name for all the Customer id 1 and after that, copy this formula for all Customer ids.
Tip: Do not forget to lock the range of the second table using “$” sign – a common error when copying this formula down. This is known as relative referencing.
- CONCATINATE() – When it comes to combine text from two or more cells into a single cell, use CONCATINATE().
Check out the following table:
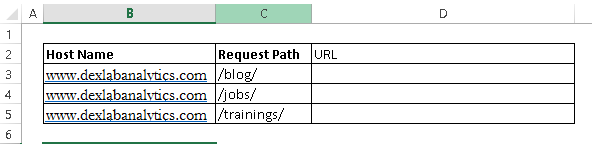 Here, we want to create a URL structured on input of host name and request path.
Use formula =concatenate(B3,C3) to solve the issue, and copy it.
Tip: Try to use “&” symbol, as it is shorter than typing a full “concatenate” formula, and does the exactly same thing. The formula can be written as “= B3&C3”.
- LEN() – It indicates the length of a cell, consisting the number of characters, including special characters and spaces.
Syntax: =Len(Text)
Example: =Len(B3) = 23
- TRIM() – This is a very useful function to wipe off text that has leading and trailing white space. When you get a large chunk of data from any database, the text found is usually padded with blanks. To deal with such problems, use this handy function.
Syntax: =Trim(Text)
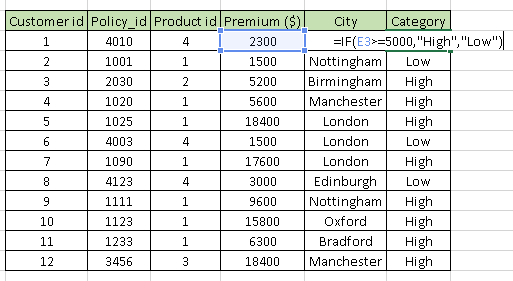
- If() – It allows you to use conditional formulas to calculate when a certain thing holds true and when not. Move your eyes below on the below table to mark each sales as High and Low.
Undoubtedly MS Excel is one of the most robust programs ever created, and it still remains to be the golden standard for all business outcomes worldwide. Irrespective of whether you are a fresh blood or a veteran user, there is always some scope to learn new things in Excel, which makes it an all-time-favorite software program.
To follow such interesting blogs on Excel, SAS, Big Data and other branches of Big Data, reach us at DexLab Analytics. We are the prime advanced Excel institute in Gurgaon and expect nothing but the best from us!
This post originally appeared on – www.analyticsvidhya.com/blog/2015/11/excel-tips-tricks-data-analysis
Interested in a career in Data Analyst?
To learn more about Data Analyst with Advanced excel course – Enrol Now.
To learn more about Data Analyst with R Course – Enrol Now.
To learn more about Big Data Course – Enrol Now.To learn more about Machine Learning Using Python and Spark – Enrol Now.
To learn more about Data Analyst with SAS Course – Enrol Now.
To learn more about Data Analyst with Apache Spark Course – Enrol Now.
To learn more about Data Analyst with Market Risk Analytics and Modelling Course – Enrol Now.
Advanced MS Excel, MS Excel Certification, MS Excel Online training, Online ms excel certification
Comments are closed here.