
With the increase in use of machine learning, for taking important corporate as well as national operational decisions, it is important to set across some core social domains. They will work to make sure that these decisions are not biased with discrimination against certain categories whatever they may be applied into.
In this post, we will discuss the crucial matters of “threshold classifiers”, a part of some machine learning operations that is critical to the issues of discrimination. With a threshold classifier one can essentially make a yes/no decision, which in turn helps to put things in perspective with one category or the other. Here we will take a look at how these classifiers work, the ways in which they can potentially be biased and how one may be able to turn an unfair classifier into a much fairer one.
By opting for a course on Machine Learning Using Python, you will be able to grasp the subject matter of this topic better.
In order to provide an illustrative example, we will concentrate on loan granting scenarios where the bank may approve or deny a loan based on one single, number computed automatically like a Credit score.
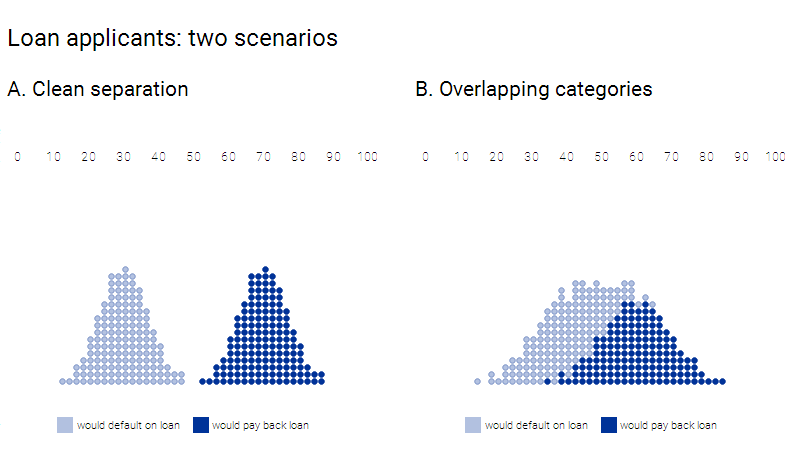
In the above-mentioned diagram, the dark dots represent people who do pay off their loans and debts, while the lighter dots show those who would not. In an ideal scenario, we may get to work with statistics that cleanly distinguish the classes as in the left example. However, sadly this is far more common to see a situation wherein at the right where the group overlaps.
A standalone statistic can stand in for several different variables, and boiling them down to just one number. In case of the credit score, which is evaluated by looking at several numbers of factors, that include income, promptness in debt repayment and much more. The number might even correctly represent the likelihood that a person may pay off a debt or also default, or might not. This relationship is actually pretty blurred and it is rare to find a statistic that correlates perfectly with real-world outcomes.
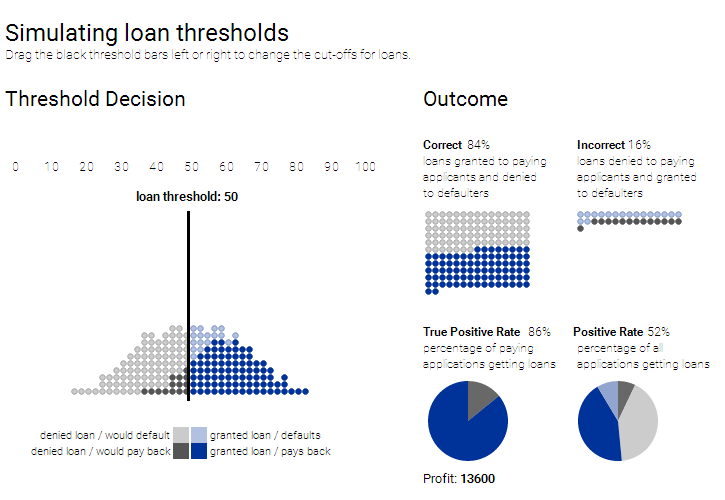
And that is exactly where the idea of a “threshold classifier” comes in: the bank selects a particular cut-off or threshold, and the people who have their credit scores are mentioned below it, will be denied of loans and people above it are usually granted the lending. However, real banks have several more additional complexities, but this simple model is often useful for studying some of the fundamental issues. Also to be clear, Google does not use credit scores for their products!
Take our credit risk management courses in Delhi to know more about financial management with data driven insights.
The above-mentioned diagram makes use of synthetic data to show how a threshold classifier works. For further simplification of the explanation, we will be staying away from realistic credit scores or the data what you see shows just the simulated data with a score based on the range of 0 to 100.
As can be well understood, selecting a threshold needs some tradeoffs. Too low and the bank wil l end up giving loans to many people who default; if too high many people who actually do deserve a loan will not get them.
So, how to determine the right threshold? That is subjective. One important goal may be to maximize the number of appropriate decisions. (Can you tell us what threshold will do that in this example scenario?)
Another financial situational goal may be to, maximize profit. At the bottom of the above mentioned diagram, is a readout hypothetical “profit” which is based on the model wherein a successful loan will make USD 300, but a default will cost a bank USD 700. So what will be the most profitable threshold? And does it match the threshold with the maximum correct decisions?
Discrimination and categorization:
The aspect of how to make a correct decision is defined, and with sensitivities to which factors will become particularly thorny, when a statistic like a credit score ends up distributed separately in between the two teams.
Let us imagine that we have two teams of people ‘orange’ and ‘blue’. We are keen on making small loans, subject to the following rules:
- A successful loan will make USD 300
- But an unsuccessful loan will make USD 700
- Everyone will have a credit score of range 0 to 100
DexLab Analytics offers credit risk analysis course online for the ease of promoting financial credit risk knowledge and data analytics know-how to the right personnel conveniently.
How to simulate loan decisions for different groups:
Drag the black threshold bars either left or right to alter the cut-offs for loans. Click on the varying preset loan strategies:
In the above mentioned case, the distributions of the two groups are slightly varying. While the blue and the orange people are equivalently likely to pay off a debt. But if you take look for a pair of thresholds that maximize total profit (or click on max profit button), then you will be able to see that the blue group is held in a slightly higher standard than the orange one.
How to improve machine-learning systems:
An important outcome of the paper by Hardt, Price, and Srebro depicted that – when mentioned essentially in any scoring system, it will be possible to efficiently to find the thresholds that meet any of the above mentioned criteria. Put in other words, even if you do not posses control over the underlying scoring system (which is quite a common case) it will still be possible to attack the issue of discrimination.
Interested in a career in Data Analyst?
To learn more about Data Analyst with Advanced excel course – Enrol Now.
To learn more about Data Analyst with R Course – Enrol Now.
To learn more about Big Data Course – Enrol Now.To learn more about Machine Learning Using Python and Spark – Enrol Now.
To learn more about Data Analyst with SAS Course – Enrol Now.
To learn more about Data Analyst with Apache Spark Course – Enrol Now.
To learn more about Data Analyst with Market Risk Analytics and Modelling Course – Enrol Now.
Comments are closed here.