
This video tutorial is on exploratory data analysis. The data is on COVID-19 cases and it has been taken from Kaggle. This tutorial is based on simple visualization of COVID-19 cases.
For code sheet and data click below.
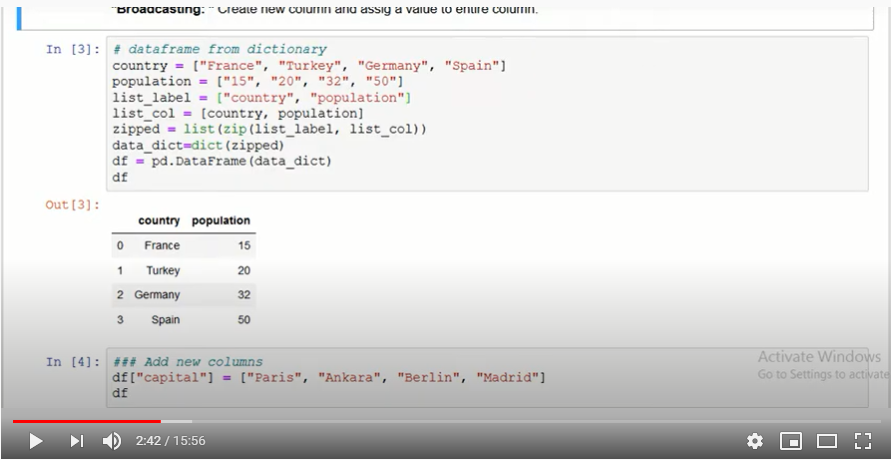
Firstly, we must call whatever libraries we need in Python. Then we must import the data we will be working on onto our platform.
Now, we must explore PANDAS. For this it is important to know that there are three types of data structures – Series, Data Frame and Panel Data. In our tutorial we will be using data frames.
Fig. 1.
Now we will plot the data we have onto a graph. When we run the program, we get a graph that shows total hospital beds, potentially available hospital beds and available hospital beds.
Fig. 2.
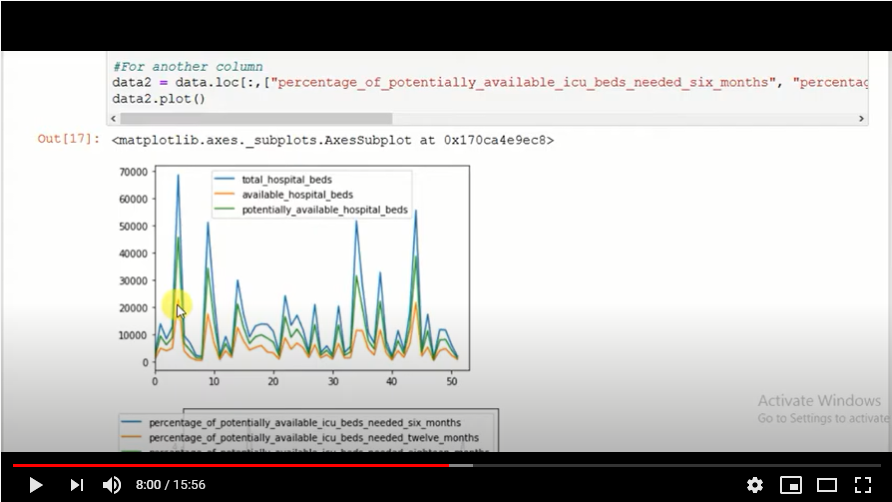
While visualizing data we must remember to keep the data as simple as possible and not make it complex. If there are too many data columns the interpretation will be a very complex one, something we do not want.
Fig. 3.
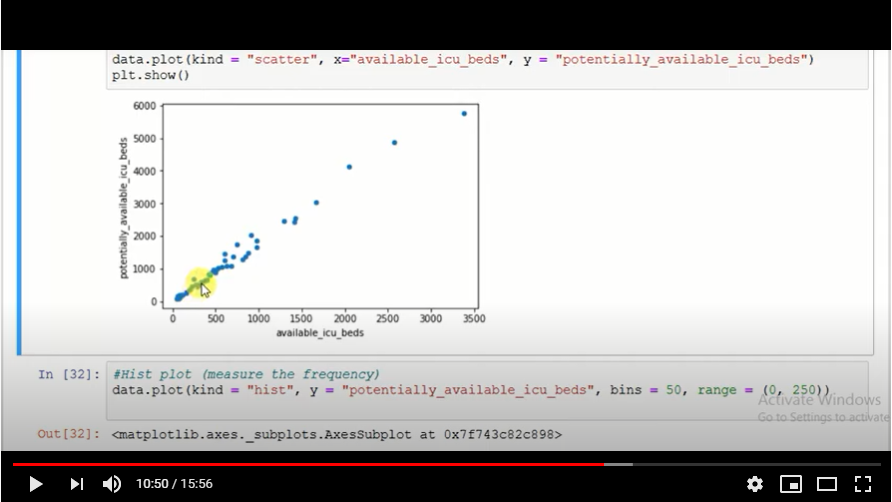
A scatter plot (Fig. 3.) is also generated to show the reading of the data available. We study the behaviour of the data on the plot.
For more on this, view the video attached herewith. And practise more and more with data from Kaggle. This tutorial was brought to you by DexLab Analytics. DexLab Analytics is a premiere data analyst training institute in Gurgaon.
.
analytics course in delhi, analytics courses, analytics courses in delhi ncr, analytics training institute, Coronavirus, Covid-19
Comments are closed here.