Getting all work done from inside a browser through an internet-enable computer is no mean feat. Just after Google cracked the idea, Microsoft and Apple soon followed the bandwagon and developed online office suites of their own.
So, do you think Google deserves the tag of top dog or should you give accolades to Microsoft for developing a feature-rich office suite?
Importantly, both are polished, powerful and serves the desired purpose well – as much as you would cling to one, without getting into the depths of how the other improved over the years.
But to understand which performs better in business, we have decided to create a regular spreadsheet – a budget tracker, and started trying out the very fundamental tasks that users carry out, like formatting cells, giving inputs, developing charts and a lot more.
DexLab Analytics is a renowned Ms Excel institute in Delhi, their business analytics courses are excellent..
To start with, the most important thing is to create a spreadsheet, while inputting data and formulas. The look of the spreadsheet is the piece de resistance, as it is the way of presentation of your data to others.
5 Popular Uses of MS Excel for Better Business Growth – @Dexlabanalytics.
Microsoft Excel
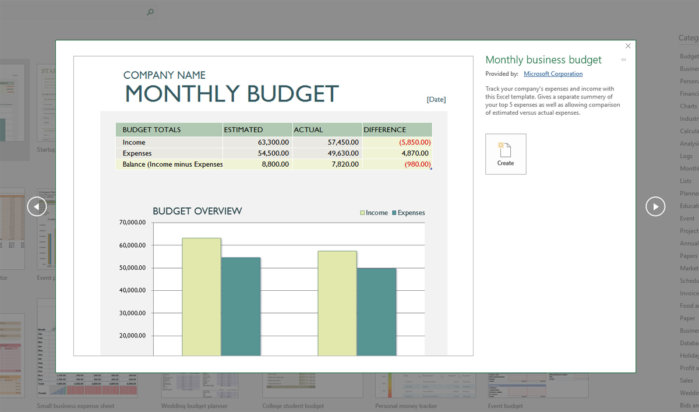
For budget templates, MS Excel is a master of all trades – whether it’s an exceptional budget requisition or a typical business budget, the chances are pretty high that you will find one that fits the bill completely. Out of 30 different templates and around thousand online templates, you have to select one suitable for your purpose, which is indeed too much of options.
Google Sheets
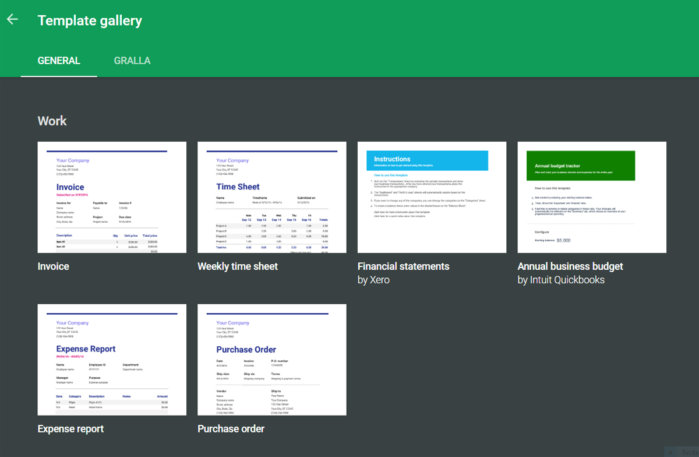
If a wide array of options is in your mind, Google Sheets is not the right place to go. Considering Excel alone has 93 templates for just budget options, the choices under Google Sheets is pretty narrow. Moreover, it doesn’t offer too many tools to beautify your spreadsheets as does Microsoft Excel. If Excel has twenty options under fonts, Google would have one, for example. They also look all lackluster and excessively simple.
Now, another way to encrypt the real meaning of data is through charts – pie charts, line charts, bar charts and what not!
Analyze Data Using These Easy but Effective MS Excel Tricks – @Dexlabanalytics.
Microsoft Excel
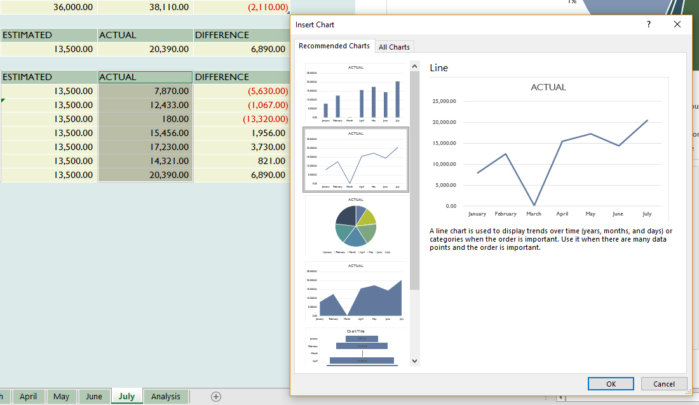
Creating charts in Excel is as easy as pie. To draw focus to your data, choose Recommended Charts from the Insert Tab. Scroll through the recommended charts and choose one that deems fit – yes, it’s that simple.
Once you are done with a chart creation, you will be spoilt for choices, in terms of editing and customizing the charts. Here, you will also get an option to generate Sparkline charts, which is another way to quickly showcase trends graphically in a precise manner.
Interesting Things to Do With Microsoft Excel – @Dexlabanalytics.
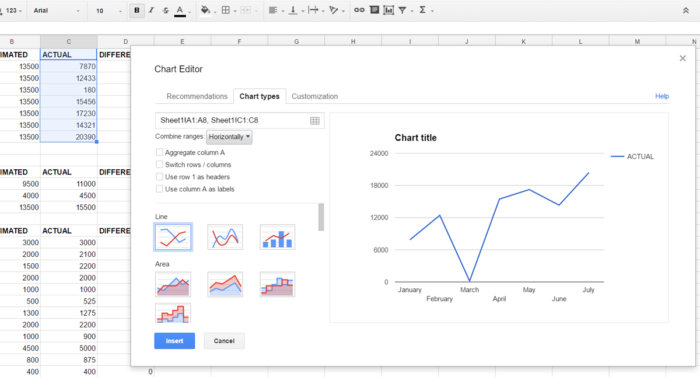
Google Sheets
Though Google Sheets is not as powerful as MS Excel in chart-making prowess, it is not bad at the same time. The best way to create a wonderful chart in here is by choosing your data, followed by selecting Insert>Chart from the menu options, available at the top of the screen. Once done, Google Sheets allow you to change them along with customizing them by either clicking left or right. But, as a matter of fact, Microsoft is a clear winner in this – with less confusing choices and easier options, creating charts in MS Excel is far better than Google Sheets.
In a nutshell, MS Excel is an excellent option for chart creation and spreadsheet customization. It also possesses a number of other features that enhances the value of your spreadsheet – so enroll in a good MS Excel Certification in Pune. DexLab Analytics offer state of the art MS Excel training courses in Pune, so join now!
Interested in a career in Data Analyst?
To learn more about Machine Learning Using Python and Spark – click here.
To learn more about Data Analyst with Advanced excel course – click here.
To learn more about Data Analyst with SAS Course – click here.
To learn more about Data Analyst with R Course – click here.
To learn more about Big Data Course – click here.
Advanced MS Excel, MS Excel Certification, MS Excel Online training, online certification, online courses, Online ms excel certification
Comments are closed here.