
Negative binomial distribution is a special case of Binomial distribution. If you haven’t checked the Exponential Distribution, then read through the Statistical Application in R & Python: EXPONENTIAL DISTRIBUTION.
It is important to know that the Negative Binomial distribution could be of two different types, i.e. – Type 1 and Type 2. In many ways, it could be seen as a generalization of the geometric distribution. The Negative Binomial Distribution essentially operates on the same principals as the binomial distribution but the objective of the former is to model for the success of an event happening in “n” number of trials. Here it is worth observing that the Geometric distribution models for the first success whereas a Negative Binomial distribution models for the Kth

This is explained below.
Type 1 Binomial distribution aims to model the trails up to and including the “kth success” in “n number of trials”. To give a simple example, imagine you are asked to predict the probability that the fourth person to hear a gossip will believe that! This kind of prediction could be made using the negative binomial type 1 distribution.
Conversely, Type 2 Binomial distribution is used to model the number of failures before the “kth success”. To give an example, imagine you are asked about how many penalty kicks it will take before a goal is scored by a particular football player. This could be modeled using a negative binomial type 2 distribution, which might be pretty tricky or almost impossible with any other methods.
The probability distribution function is given below:
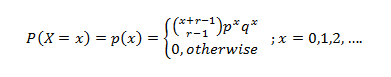
In the next section, we will take you through its practical application in Python and R.
Application:
Mr. Singh works in an Insurance Company where his target is to sale a minimum of five policies in a day. On a particular day, he had already sold 2 policies after numerous attempts. The probability of sales on each policy is 0.6. Now, if the policies may be considered as independent Bernoulli trials, then:
- What is the probability that he has exactly 4 failed attempts before his 3rd successful sales of the day?
- What is the probability that he was fewer than 4 failed attempts before his 3rd successful sales of the day?
So, the number of sales = 3.
The probability of failed attempts is 4.
The success of each sale is 0.6.
Calculate Negative Binomial Distribution in R:
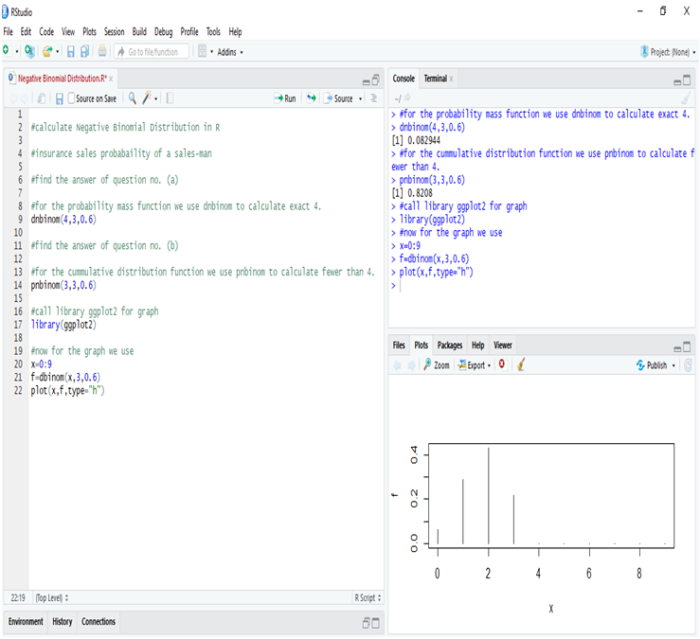
In R, we calculate negative binomial distribution to find the probability of insurance sales. Thus, we get,
- The probability that he has exactly 4 failed attempts before his 3rd successful sales are 8.29%.
- The probability that he has fewer than 4 failed attempts before his 3rd successful sales is 82.08%.
Hence, we can see that chances are quite high that Mr. Singh will succeed in making a sale after 4 failed attempts.
Calculate Negative Binomial Distribution in Python:
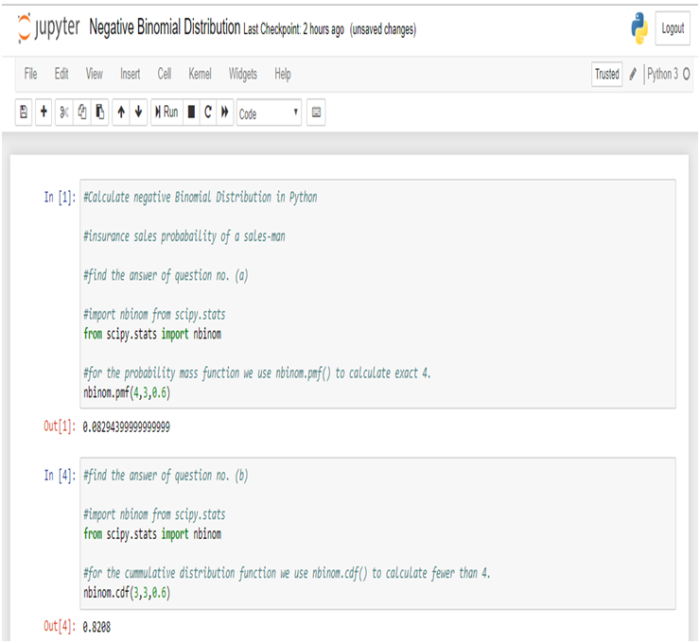
In Python, we get the same results as above.
Conclusion:
Negative Binomial distribution is the discrete probability distribution that is actually used for calculating the success and failure of any observation. When applied to real-world problems, the outcomes of the successes and failures may or may not be the outcomes we ordinarily view as good and bad, respectively.
Suppose we used the negative binomial distribution to model the number of days a certain machine works before it breaks down. In this case, “success” would be the days that the machine worked properly, whereas the day when the machine breaks down would be a “failure”. Another example would be, if we used the negative binomial distribution to model the number of attempts an athlete makes on goal before scoring r goals, though, then each unsuccessful attempt would be a “success”, and scoring a goal would be “failure”.
This blog will surely aid in developing a better understanding of how negative binomial distribution works in practice. If you have any comments please leave them below. Besides, if you are interested in catching up with the cutting edge technologies, then reach the premium training institute of Data Science and Machine Learning leading the market with the top-notch Machine Learning course in India.
Interested in a career in Data Analyst?
To learn more about Data Analyst with Advanced excel course – Enrol Now.
To learn more about Data Analyst with R Course – Enrol Now.
To learn more about Big Data Course – Enrol Now.To learn more about Machine Learning Using Python and Spark – Enrol Now.
To learn more about Data Analyst with SAS Course – Enrol Now.
To learn more about Data Analyst with Apache Spark Course – Enrol Now.
To learn more about Data Analyst with Market Risk Analytics and Modelling Course – Enrol Now.
Comments are closed here.