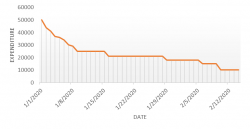
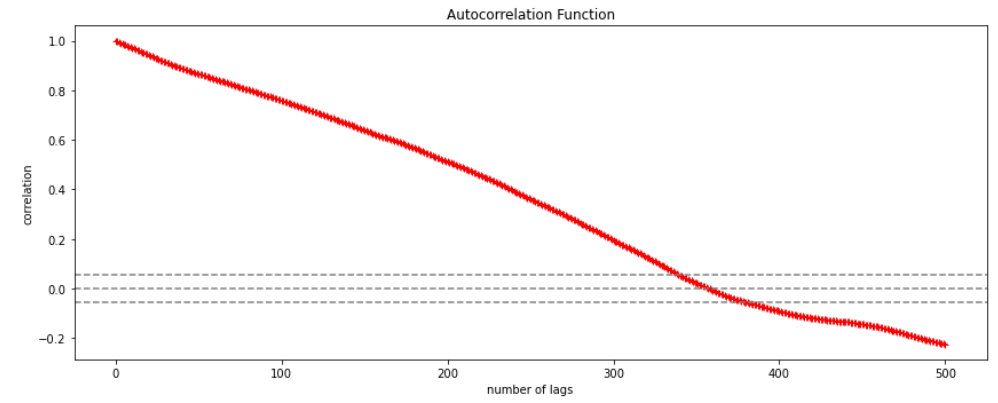
Autocorrelation is a special case of correlation. It refers to the relationship between successive values of the same variables .For example if an individual with a consumption pattern:-
![]()
spends too much in period 1 then he will try to compensate that in period 2 by spending less than usual. This would mean that Ut is correlated with Ut+1 . If it is plotted the graph will appear as follows :
Positive Autocorrelation : When the previous year’s error effects the current year’s error in such a way that when a graph is plotted the line moves in the upward direction or when the error of the time t-1 carries over into a positive error in the following period it is called a positive autocorrelation.
Negative Autocorrelation : When the previous year’s error effects the current year’s error in such a way that when a graph is plotted the line moves in the downward direction or when the error of the time t-1 carries over into a negative error in the following period it is called a negative autocorrelation.
Now there are two ways of detecting the presence of autocorrelation
By plotting a scatter plot of the estimated residual (ei) against one another i.e. present value of residuals are plotted against its own past value.
If most of the points fall in the 1st and the 3rd quadrants , autocorrelation will be positive since the products are positive.
If most of the points fall in the 2nd and 4th quadrant , the autocorrelation will be negative, because the products are negative.
By plotting ei against time : The successive values of ei are plotted against time would indicate the possible presence of autocorrelation .If e’s in successive time show a regular time pattern, then there is autocorrelation in the function. The autocorrelation is said to be negative if successive values of ei changes sign frequently.
First Order of Autocorrelation (AR-1)
When t-1 time period’s error affects the error of time period t (current time period), then it is called first order of autocorrelation.
AR-1 coefficient p takes values between +1 and -1
The size of this coefficient p determines the strength of autocorrelation.
A positive value of p indicates a positive autocorrelation.
A negative value of p indicates a negative autocorrelation
In case if p = 0, then this indicates there is no autocorrelation.
To explain the error term in any particular period t, we use the following formula:-
Where Vt= a random term which fulfills all the usual assumptions of OLS
How to find the value of p?
One can estimate the value of ρ by applying the following formula :-
AI and Machine Learning, analytics course in delhi, analytics courses, analytics courses in delhi ncr, analytics training institute, artificial intelligence analytics, artificial intelligence certification, artificial intelligence training institute, Big Data Analytics, Big data courses, Business Intelligence, Business Intelligence Courses, Business Intelligence program, Certificate in Business Analytics, Credit and Market Risk, Credit Risk, credit risk analysis, Credit Risk Analytics And Modeling, credit risk analytics training, Credit Risk Modelling, Credit Risk Modelling Using SAS, customer market analysis, customer marketing analytics courses, Data analyst certification, Data analyst course, data analyst course in delhi, data analyst institute, Data analyst training institute, data analytics, data analytics certification courses, Data and Risk Analytics, data science, Data Science Certification, Data Science Classes, Data Science Courses, data science online learning, Data Science training, Data Science training institute, Data Scientists, deep learning course, Deep Learning Training, Deep Learning Training Courses, Deep learning Training Institutes, Machine Learning, Machine Learning Certification, Machine Learning course, Machine Learning course in Gurgaon, Machine Learning course online, Machine Learning Courses, Market Analysis, Market Risk Analytics, market risk certification, market risk courses, Market Risk Management, market risk modeling analyst, market risk modeling training, Market Risk Modelling, Market Risk Modelling interactive session, Online Data Science Certification, python certification course, Python courses, python data science course, Python for data analysis


Comments are closed here.